VibeBI serves three distinct audiences — business users who need instant answers, governance admins who keep data safe and consistent, and data engineers who build the warehouse. Those audiences also map to clear decision rights: business owns outcomes, data owns meaning and standards, IT owns security and reliability — while AI automates much of the execution. Here's what each sees when they open the desktop app.
Decision right · Owns outcomes
Ask plain-language questions and get governed answers in seconds. Build durable dashboards in minutes, and publish to a shared catalog — all without writing SQL or filing a ticket.
Business users ask questions in plain language. The BI agent grounds every answer in live governed gold models, queries the warehouse in real-time, and returns a real report — not a hallucination, not a stale screenshot, not a guess. Every number is traceable back to its source. Curiosity doesn't die in a ticket queue anymore.
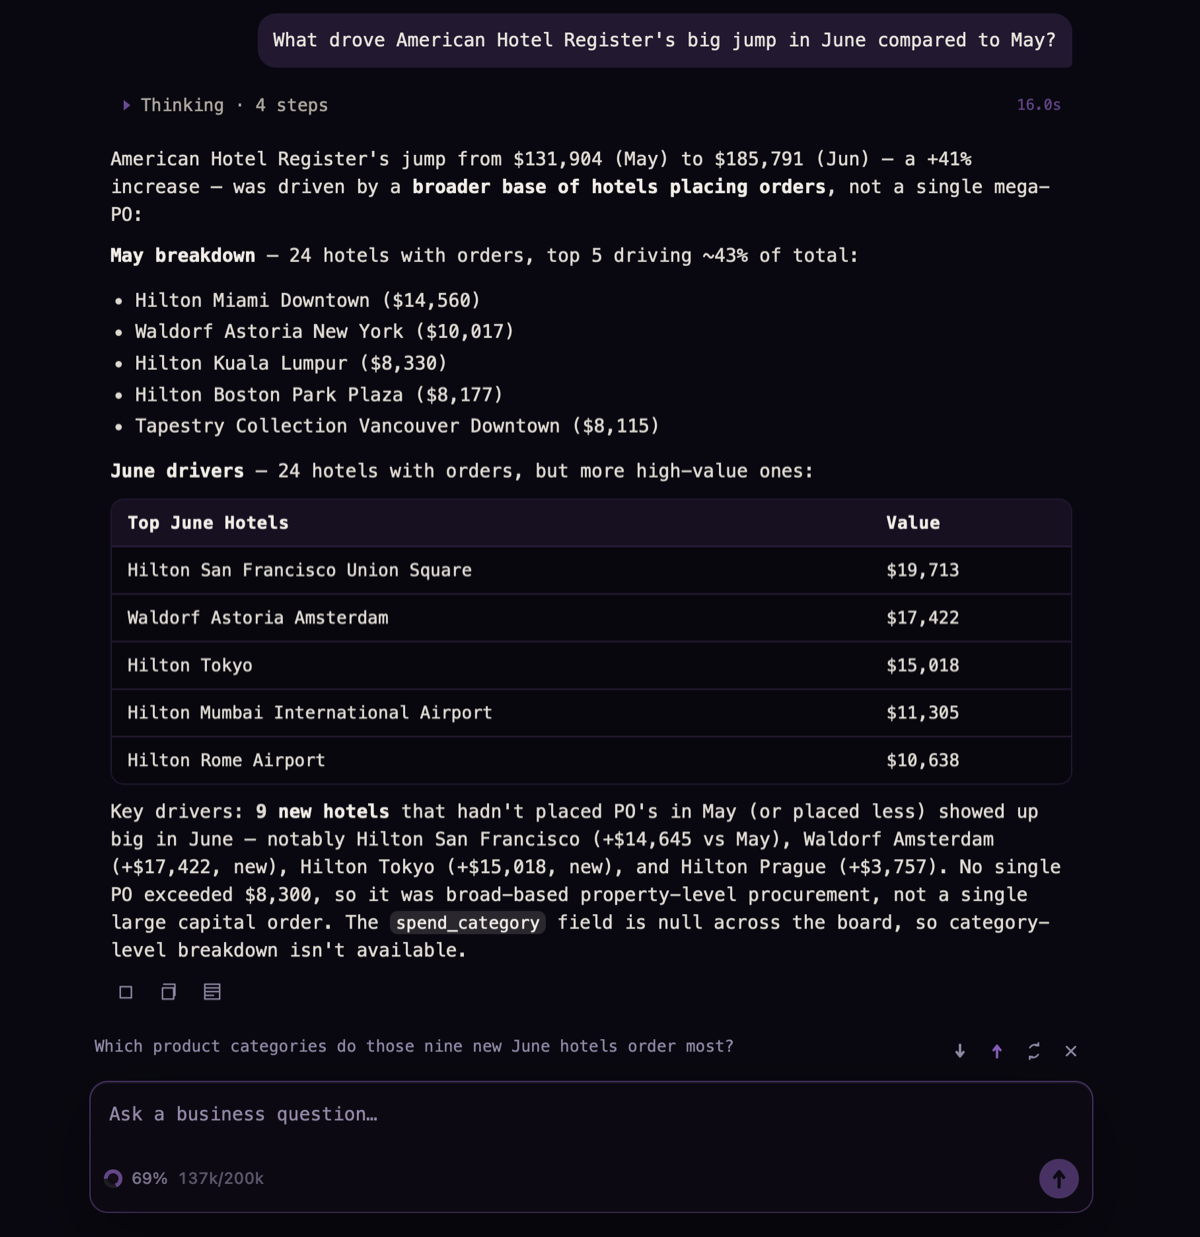 Ask questions in plain language — the agent queries live governed models and returns a real, traceable report, not a guess. Click to enlarge.
A fully interactive, real-time dashboard — charts, KPIs, filters — built in a few minutes. And because it reads from the semantic layer rather than raw tables, it's durable: used by many teams, for the long term, surviving upstream schema changes without breaking. The kind of dashboard that becomes a team's daily command center, not next quarter's maintenance ticket.
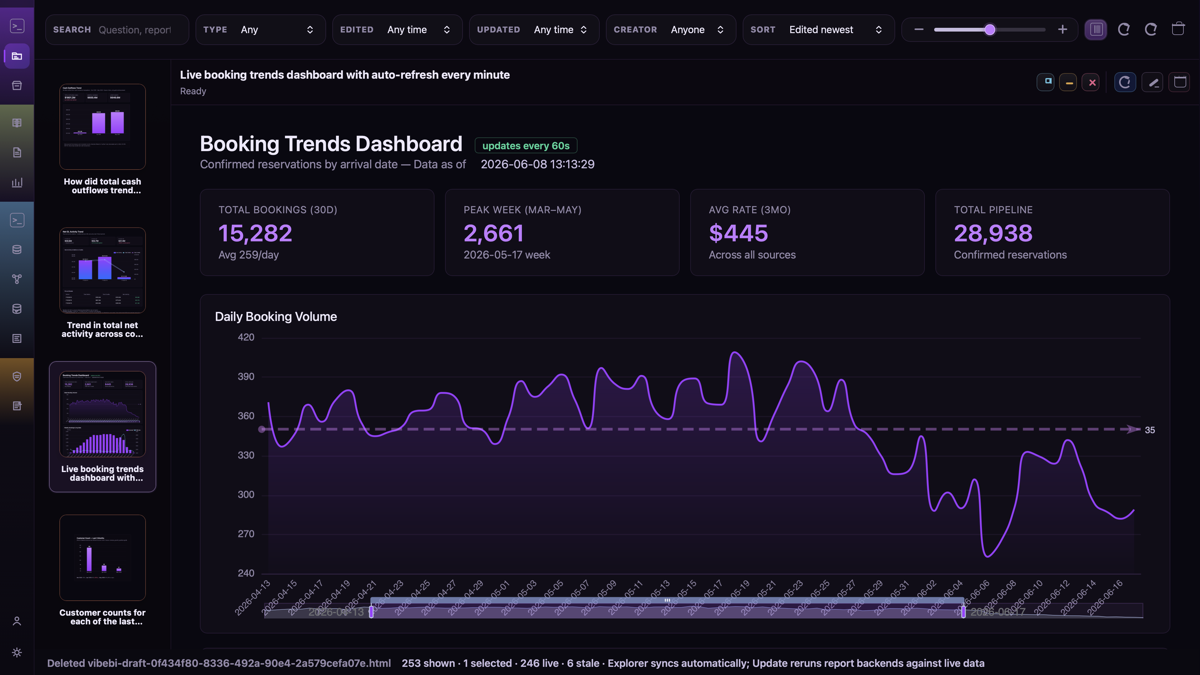 Interactive dashboard with charts, KPIs, and filters — built in minutes from the semantic layer, durable across schema changes. Click to enlarge.
Reports get published to the enterprise report store — a single, governed, searchable catalog for the entire organization. Every report carries its access control metadata with it: data domain tags, classification levels, and viewer entitlements. Viewers only see what they're entitled to. No data leaks through sharing. One source of truth, one catalog, zero sprawl.
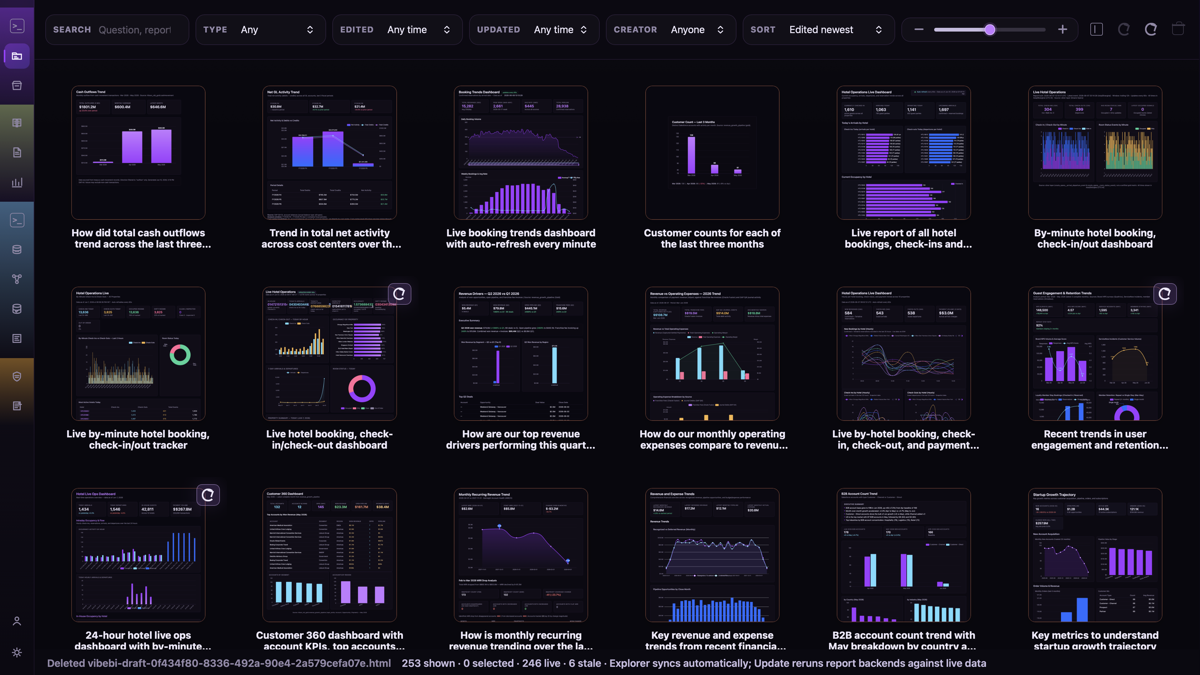 A governed, searchable catalog — every report carries domain tags, classification levels, and viewer entitlements. One source of truth, zero sprawl. Click to enlarge.
The platform surfaces auto-generated business drivers — the "why" behind the numbers — so business users get context, not just data. Revenue is up? The driver tells you which product lines and customer segments moved the needle, and by how much. It's the insight behind the insight, generated without anyone asking.
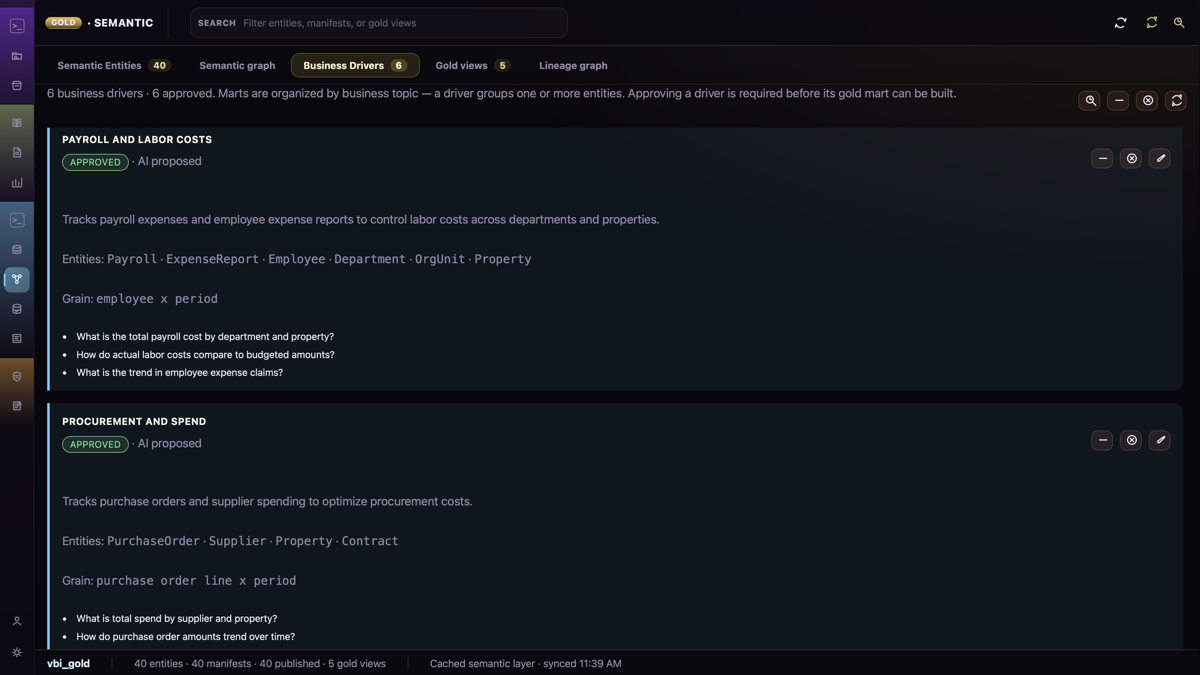 The "why" behind every number — which product lines and customer segments moved the needle, surfaced automatically. Click to enlarge.
Decision right · Owns meaning & standards
Define governance once and watch it cascade everywhere. Auto-detect domains, set classification policies, configure agent behavior, and trace every action through rich structured logging — all governed from one place.
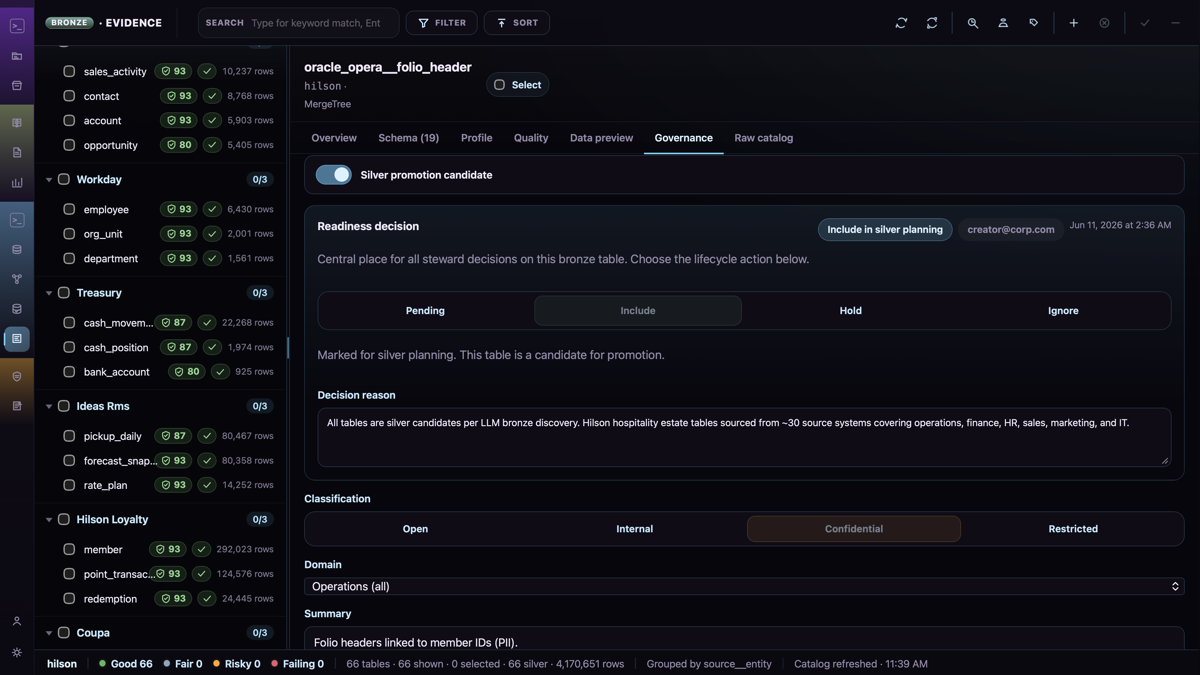
The agent analyzes table structures and column values to detect business domains — Revenue, Customer, Supply Chain, HR — and tags every table and field accordingly. Classification levels are proposed automatically. What used to require months of stakeholder workshops and manual tagging now happens in the background while you watch. No one writes a single rule.
 Tables and columns auto-tagged by business domain and classification level — what took months of workshops now happens in the background. Click to enlarge.
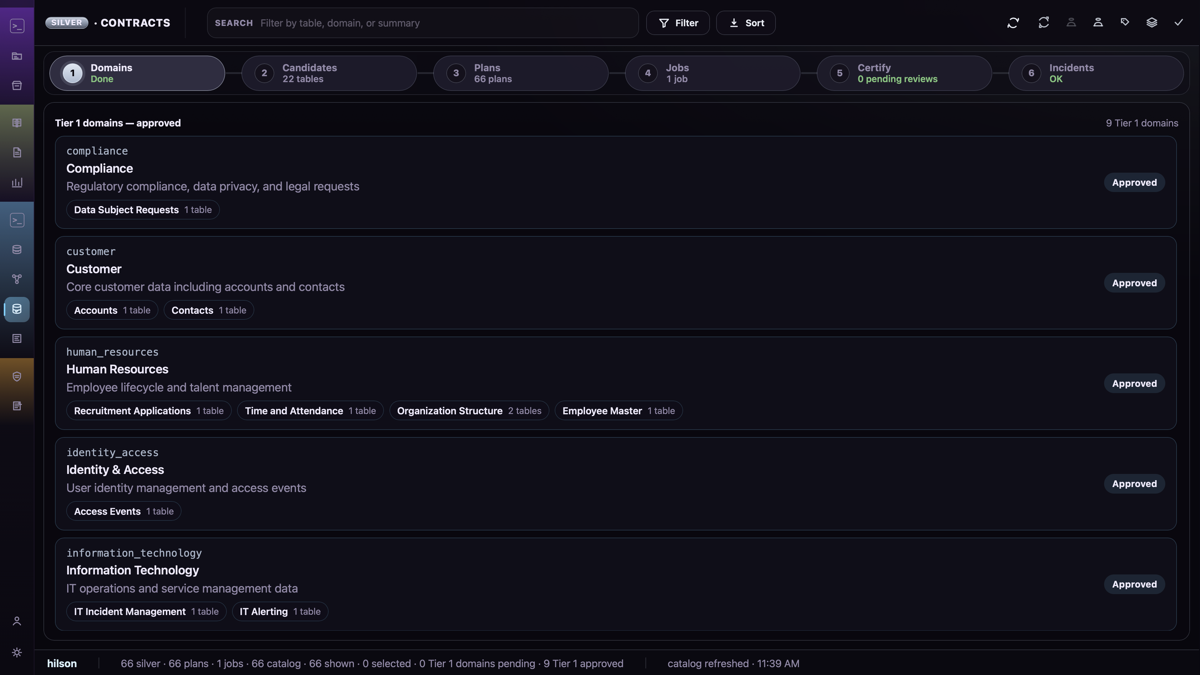
Define governance rules once — domain ownership, classification tiers, access policies — and the platform cascades them end-to-end. Every silver view, gold model, report, and share link inherits the rules you set at the top. Change a rule once, and everything downstream updates automatically. No more fragmented, drift-prone permission silos. Governance that actually governs.
 Define governance rules once — domain ownership, classification, access policies — and every downstream artifact inherits them. Click to enlarge.
VibeBI automatically captures business terms and metric definitions as users chat with the BI agent — no separate glossary tool, no manual entry. It starts with personal terms: definitions you create and refine in your own conversations, private to you. When a definition proves valuable, it can be promoted through a lightweight workflow to team level, then company level, and finally to certified metrics with full governance and lineage. The result is a living, self-growing business glossary that stays fresh through everyday use while remaining centrally governed. No more stale wikis, no more fragmented spreadsheet definitions, no more "what does this metric actually mean?" debates — your organization's knowledge base grows organically, with governance baked in at every promotion step.
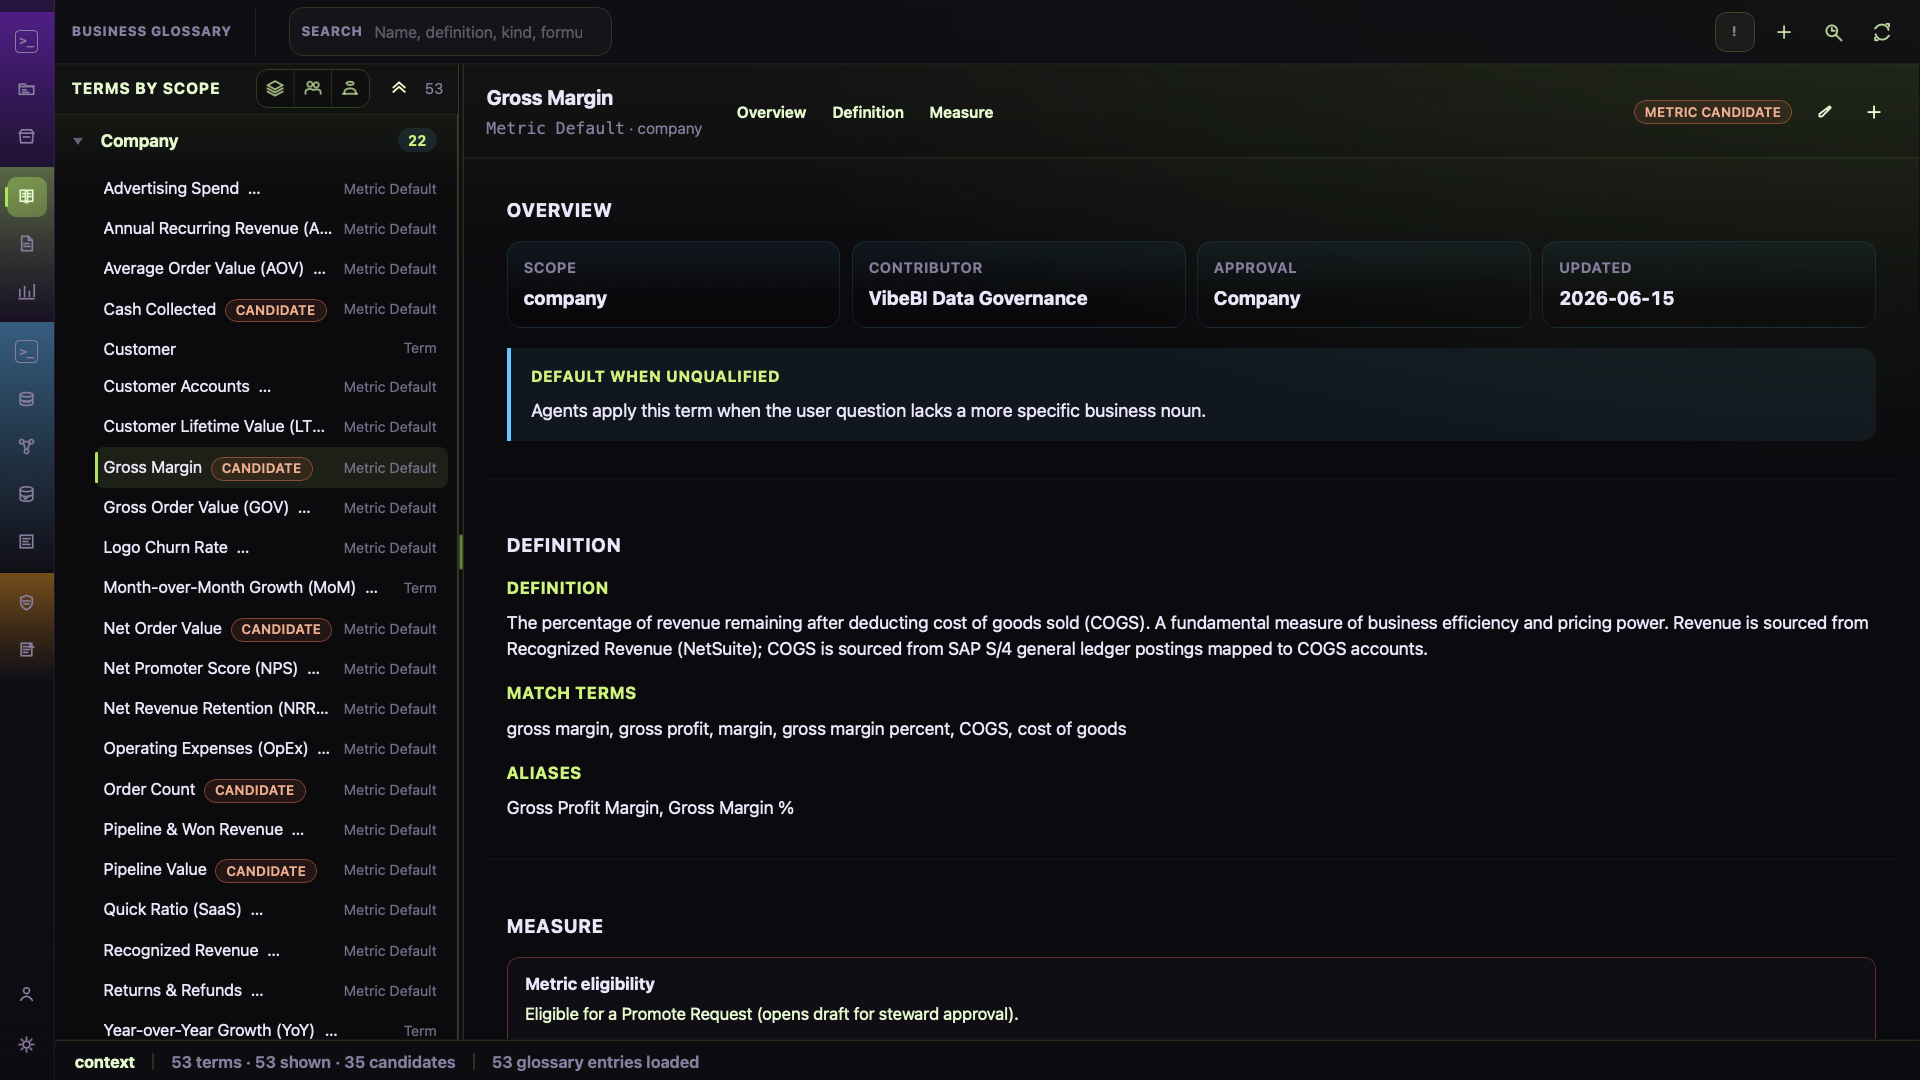 Team & company terms — definitions promoted through governance levels, from personal to team to company to certified metrics, with full lineage. Click to enlarge.
Under the hood: rich, structured logging across every layer — database queries, LLM calls, agent reasoning steps, data governance actions. Everything is traceable, searchable, and debuggable. No black boxes, no "the agent did something weird and we don't know why." When something goes wrong, you can see exactly what happened at every layer and fix it.
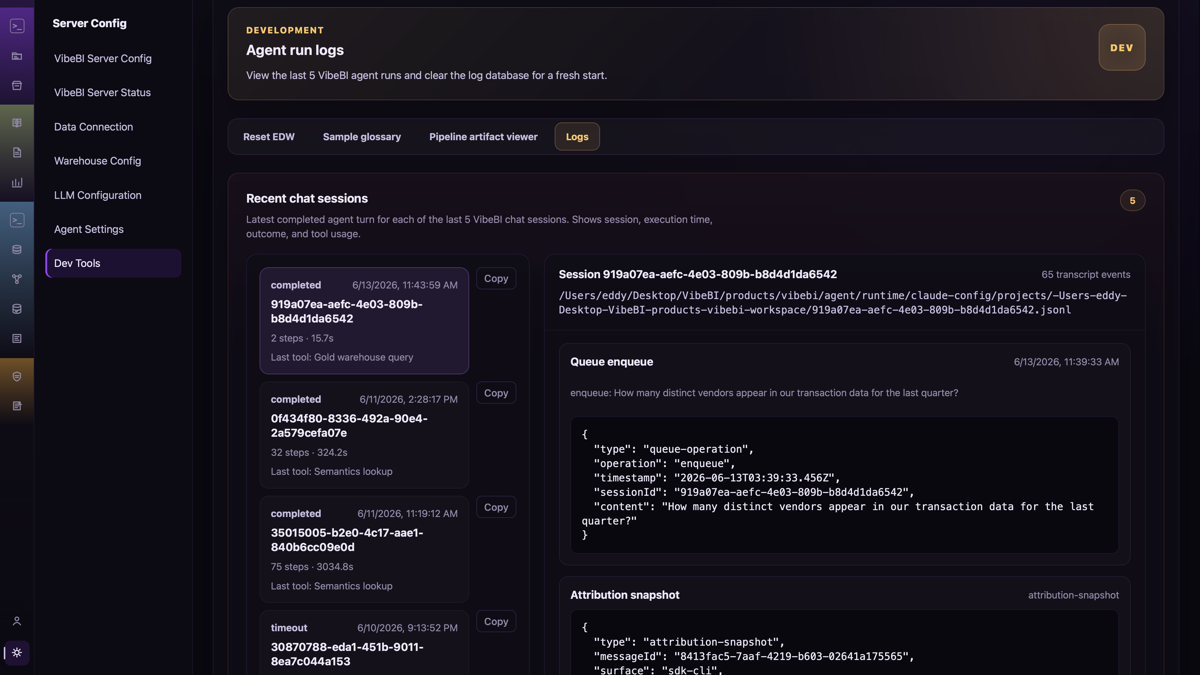 Structured, searchable logs across DB queries, LLM calls, agent reasoning, and governance actions — no black boxes. Click to enlarge.
Decision right · Owns security & reliability
Point the agent at your bronze warehouse and watch it catalog, profile, build semantic models, generate gold star schemas with full lineage, and monitor performance — work that used to take quarters, done in hours.
Building an enterprise data warehouse isn't a batch job you hand off to a black-box AI — it's a conversation. The AI proposes cataloging strategies, semantic models, and gold schemas; the developer reviews, steers, and approves. Every step is interactive, inspectable, and reversible. The AI handles the mechanical heavy lifting — profiling millions of rows, resolving entities, generating DDL — while the human brings domain knowledge, architectural intent, and the final call on what ships. Together, they build a warehouse in hours that used to take quarters. This is what the symbiosis actually looks like in VibeBI.
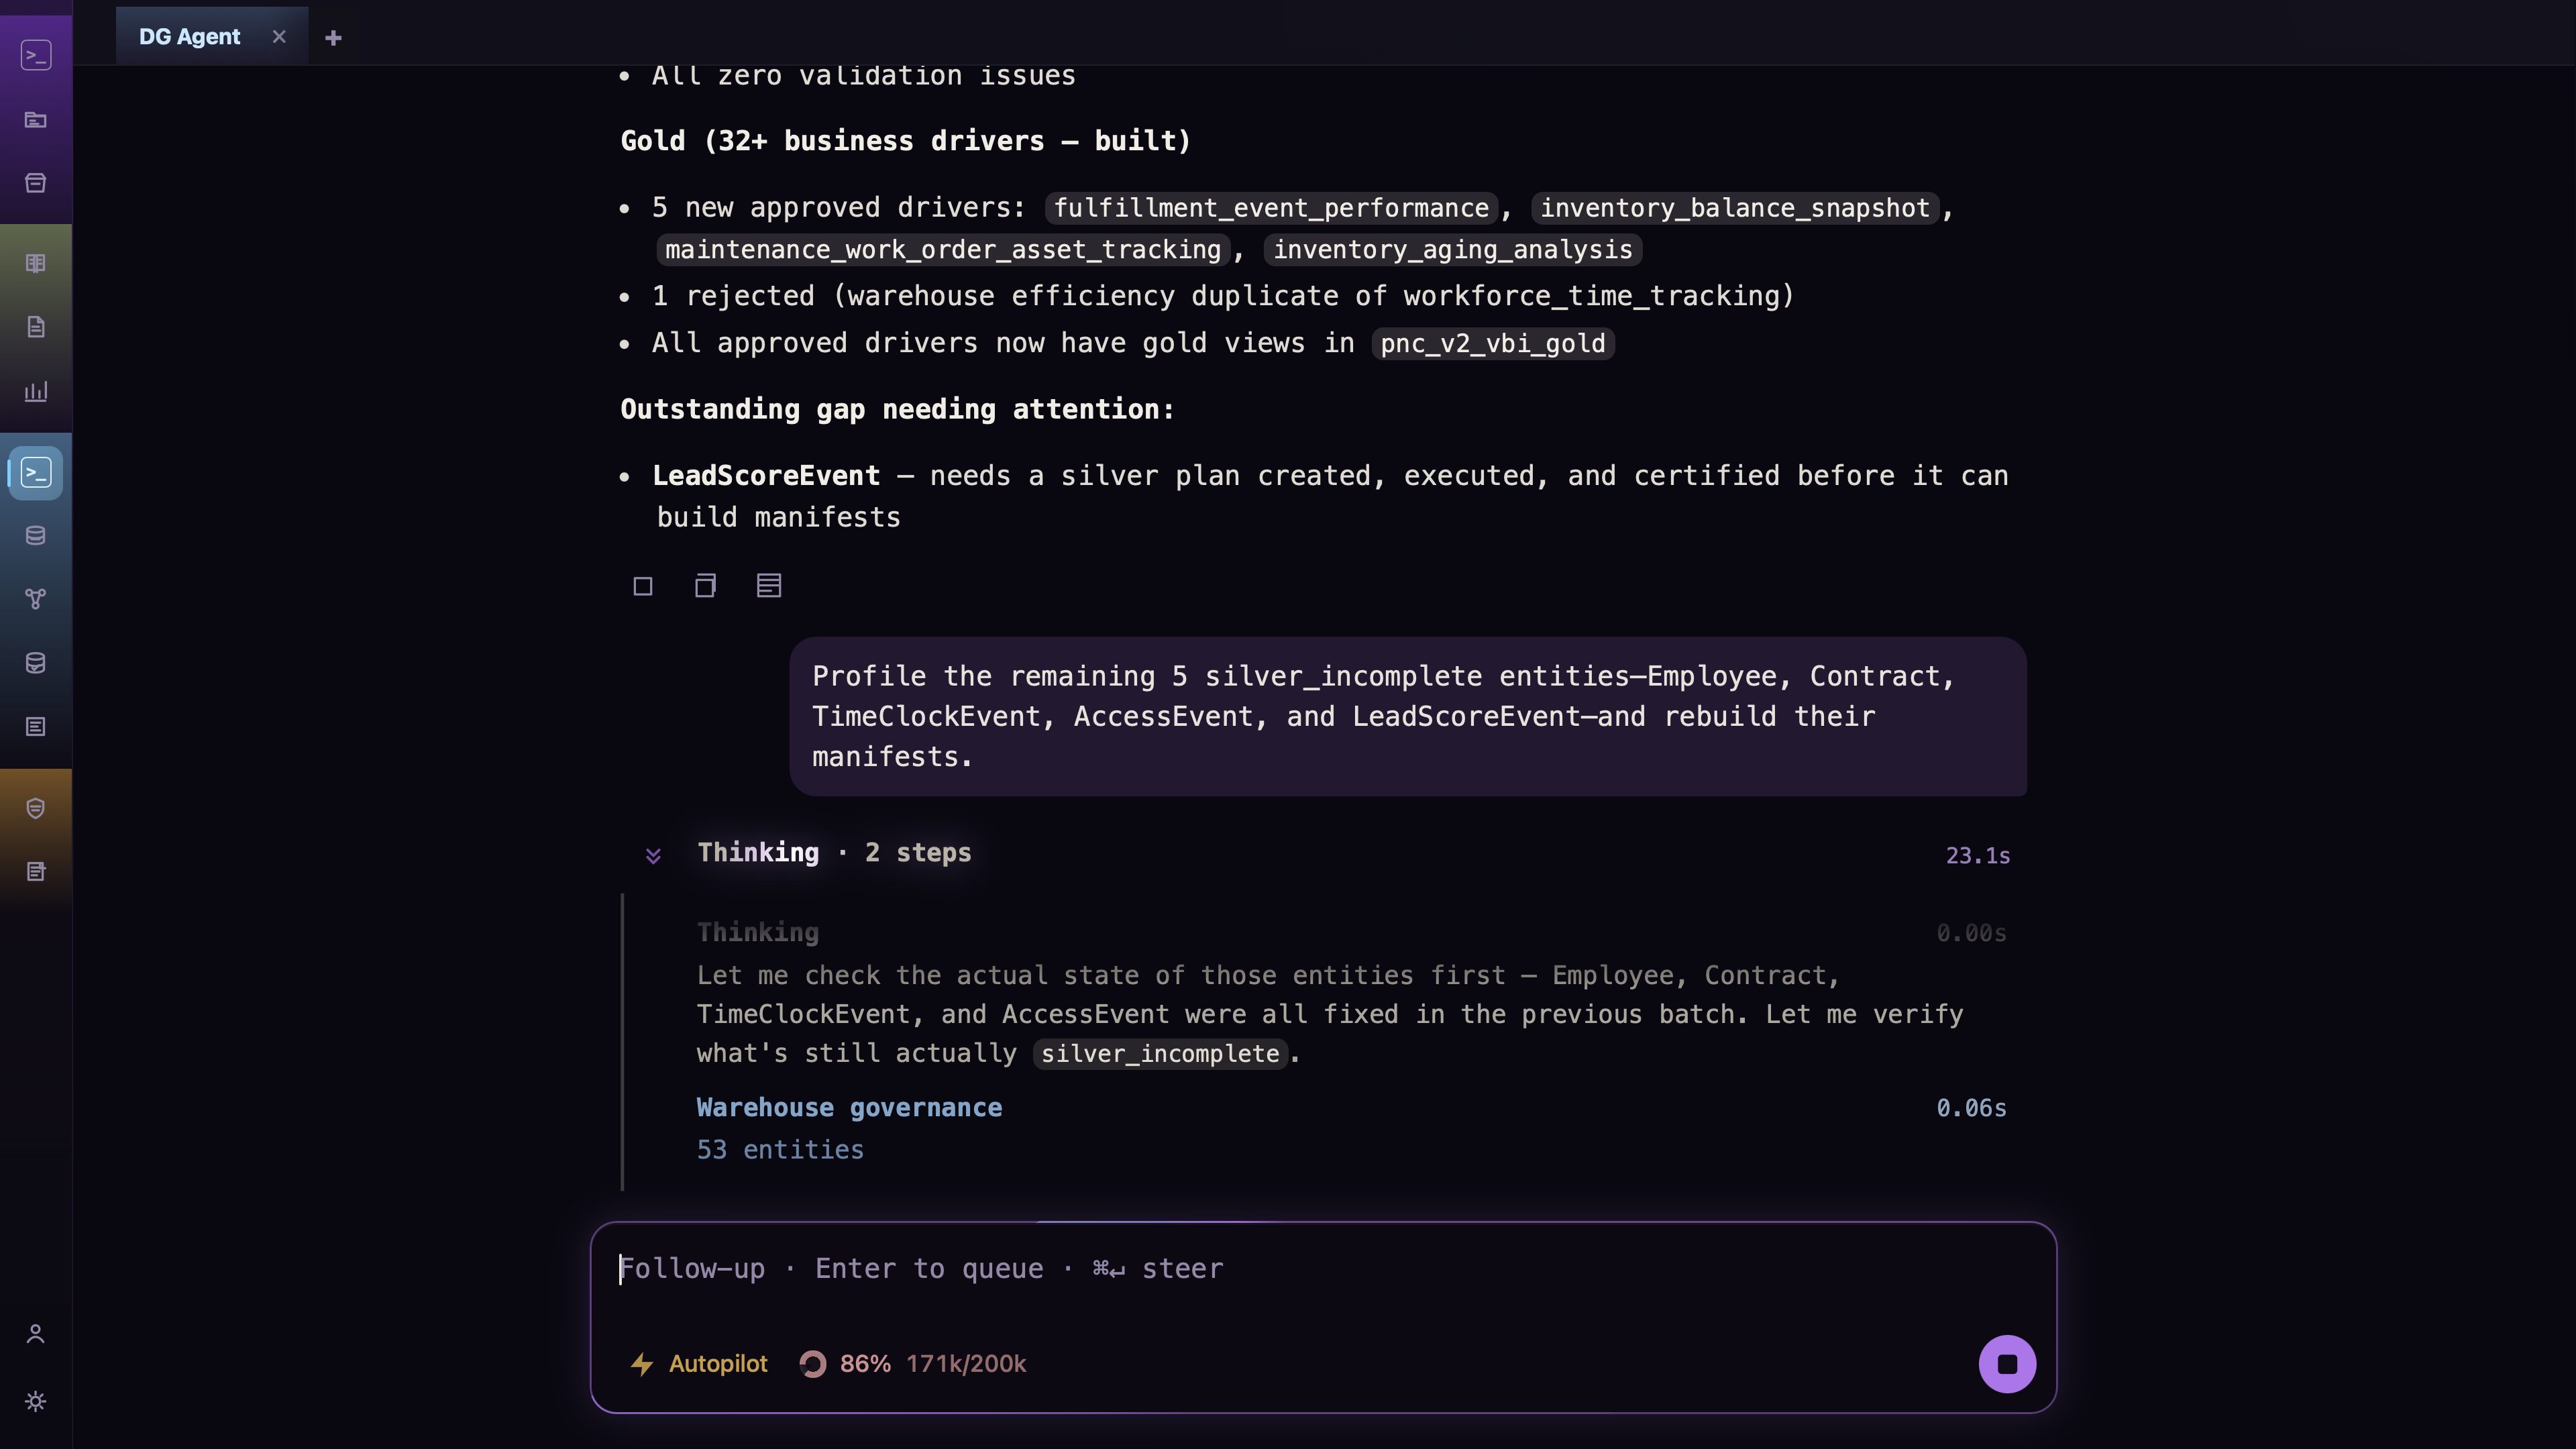 The AI proposes, the human steers — every cataloging decision, model design, and schema generation is interactive and inspectable. Click to enlarge.
Point VibeBI at your bronze warehouse, and the Data Governance agent goes to work. It catalogs every table, profiles columns, enriches metadata, and rates data quality — all automatically. No manual spreadsheet cataloging. No guessing what's in the warehouse. Over the course of a session, you get a complete, scored map of your raw data estate, with quality ratings you can act on.
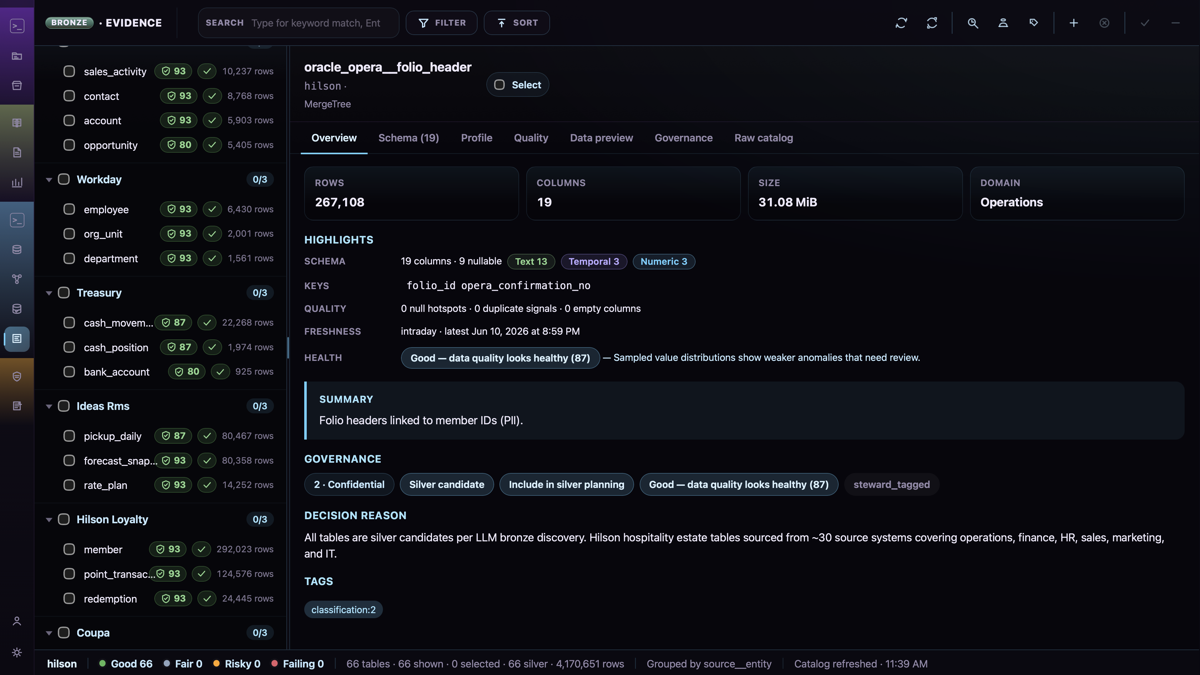 Every bronze table cataloged, profiled, metadata-enriched and quality-rated — a complete scored map of your data estate, built session by session. Click to enlarge.
With bronze profiled and domains tagged, the agent drafts conformed silver views, resolves entities, and builds the complete semantic layer — entities, grains, mappings, certified metrics — all auto-generated, visualized, and ready for steward approval. Every metric gets one canonical definition, one grain, one gold binding. No more reconciliation meetings.
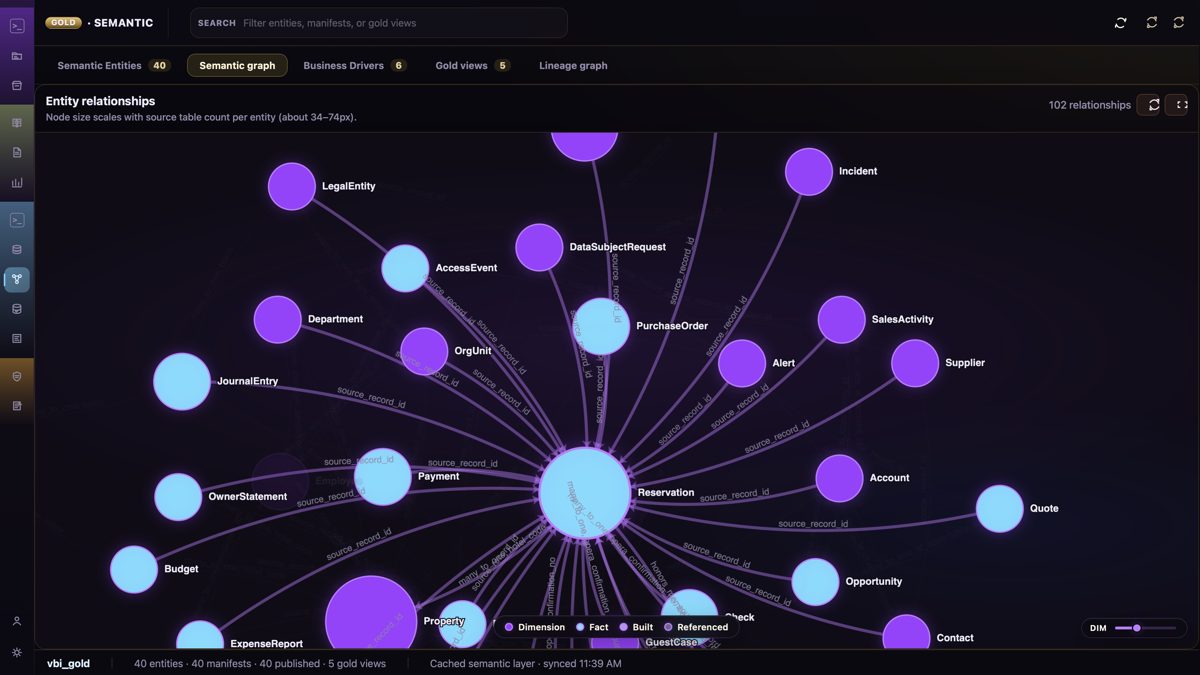 Conformed silver views, resolved entities, certified metrics — the full semantic layer, auto-generated and visualized. Click to enlarge.
The Alchemist builds gold star-schema models — facts and dimensions — from certified silver views. Every gold model ships with complete, visualized lineage: trace any metric back through silver to its bronze source in seconds. Auditors love it. Engineers trust it. And when something upstream changes, you see exactly what's affected before anything breaks.
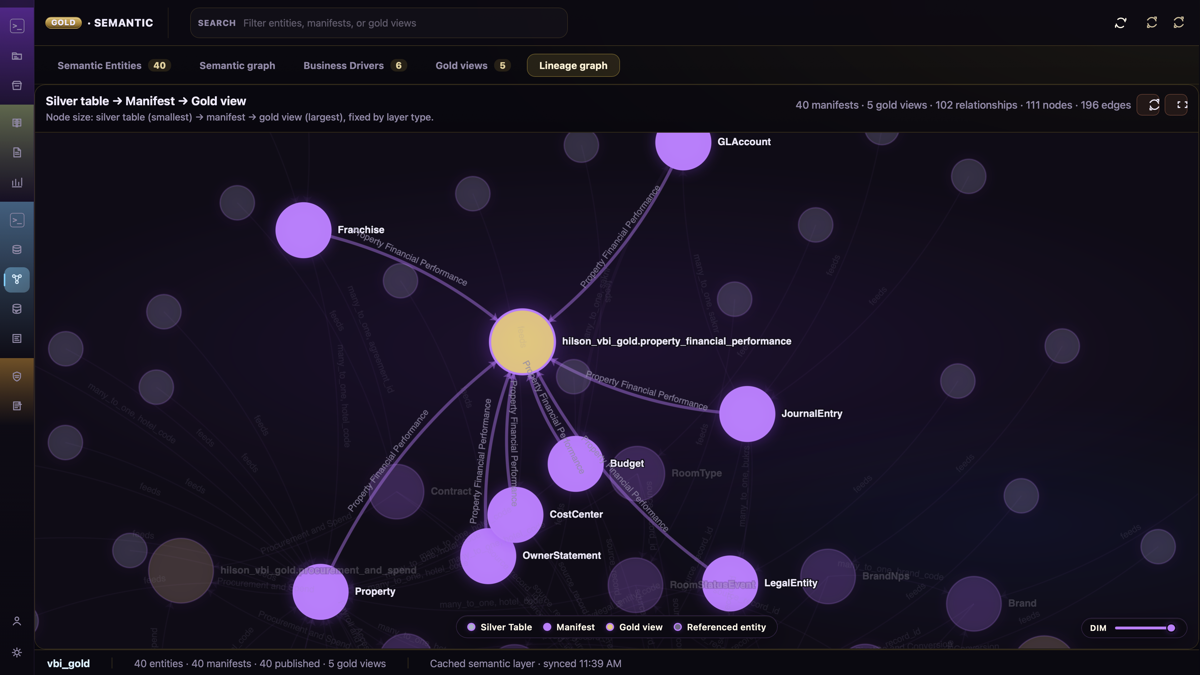 Gold star-schema facts and dimensions with complete visualized lineage — trace any metric back to its bronze source in seconds. Click to enlarge.
Every BI chat turn feeds a steward-reviewed learning loop. User questions, sparse metrics from live probes, query errors, and uncovered entities accumulate as signals. Stewards open Gold → BI Learning to process the backlog, dismiss noise, and either step through approvals or run a full pipeline that proposes bi_learning drivers, publishes rebuilt manifests, and rebuilds gold — all behind the same certification gates as the initial refinery.
The BI agent sees known gaps on later turns (null measures, pending drivers) so it answers honestly instead of re-probing dead ends. The DG agent uses the same backlog when regenerating business drivers. Nothing ships to production without steward approval.
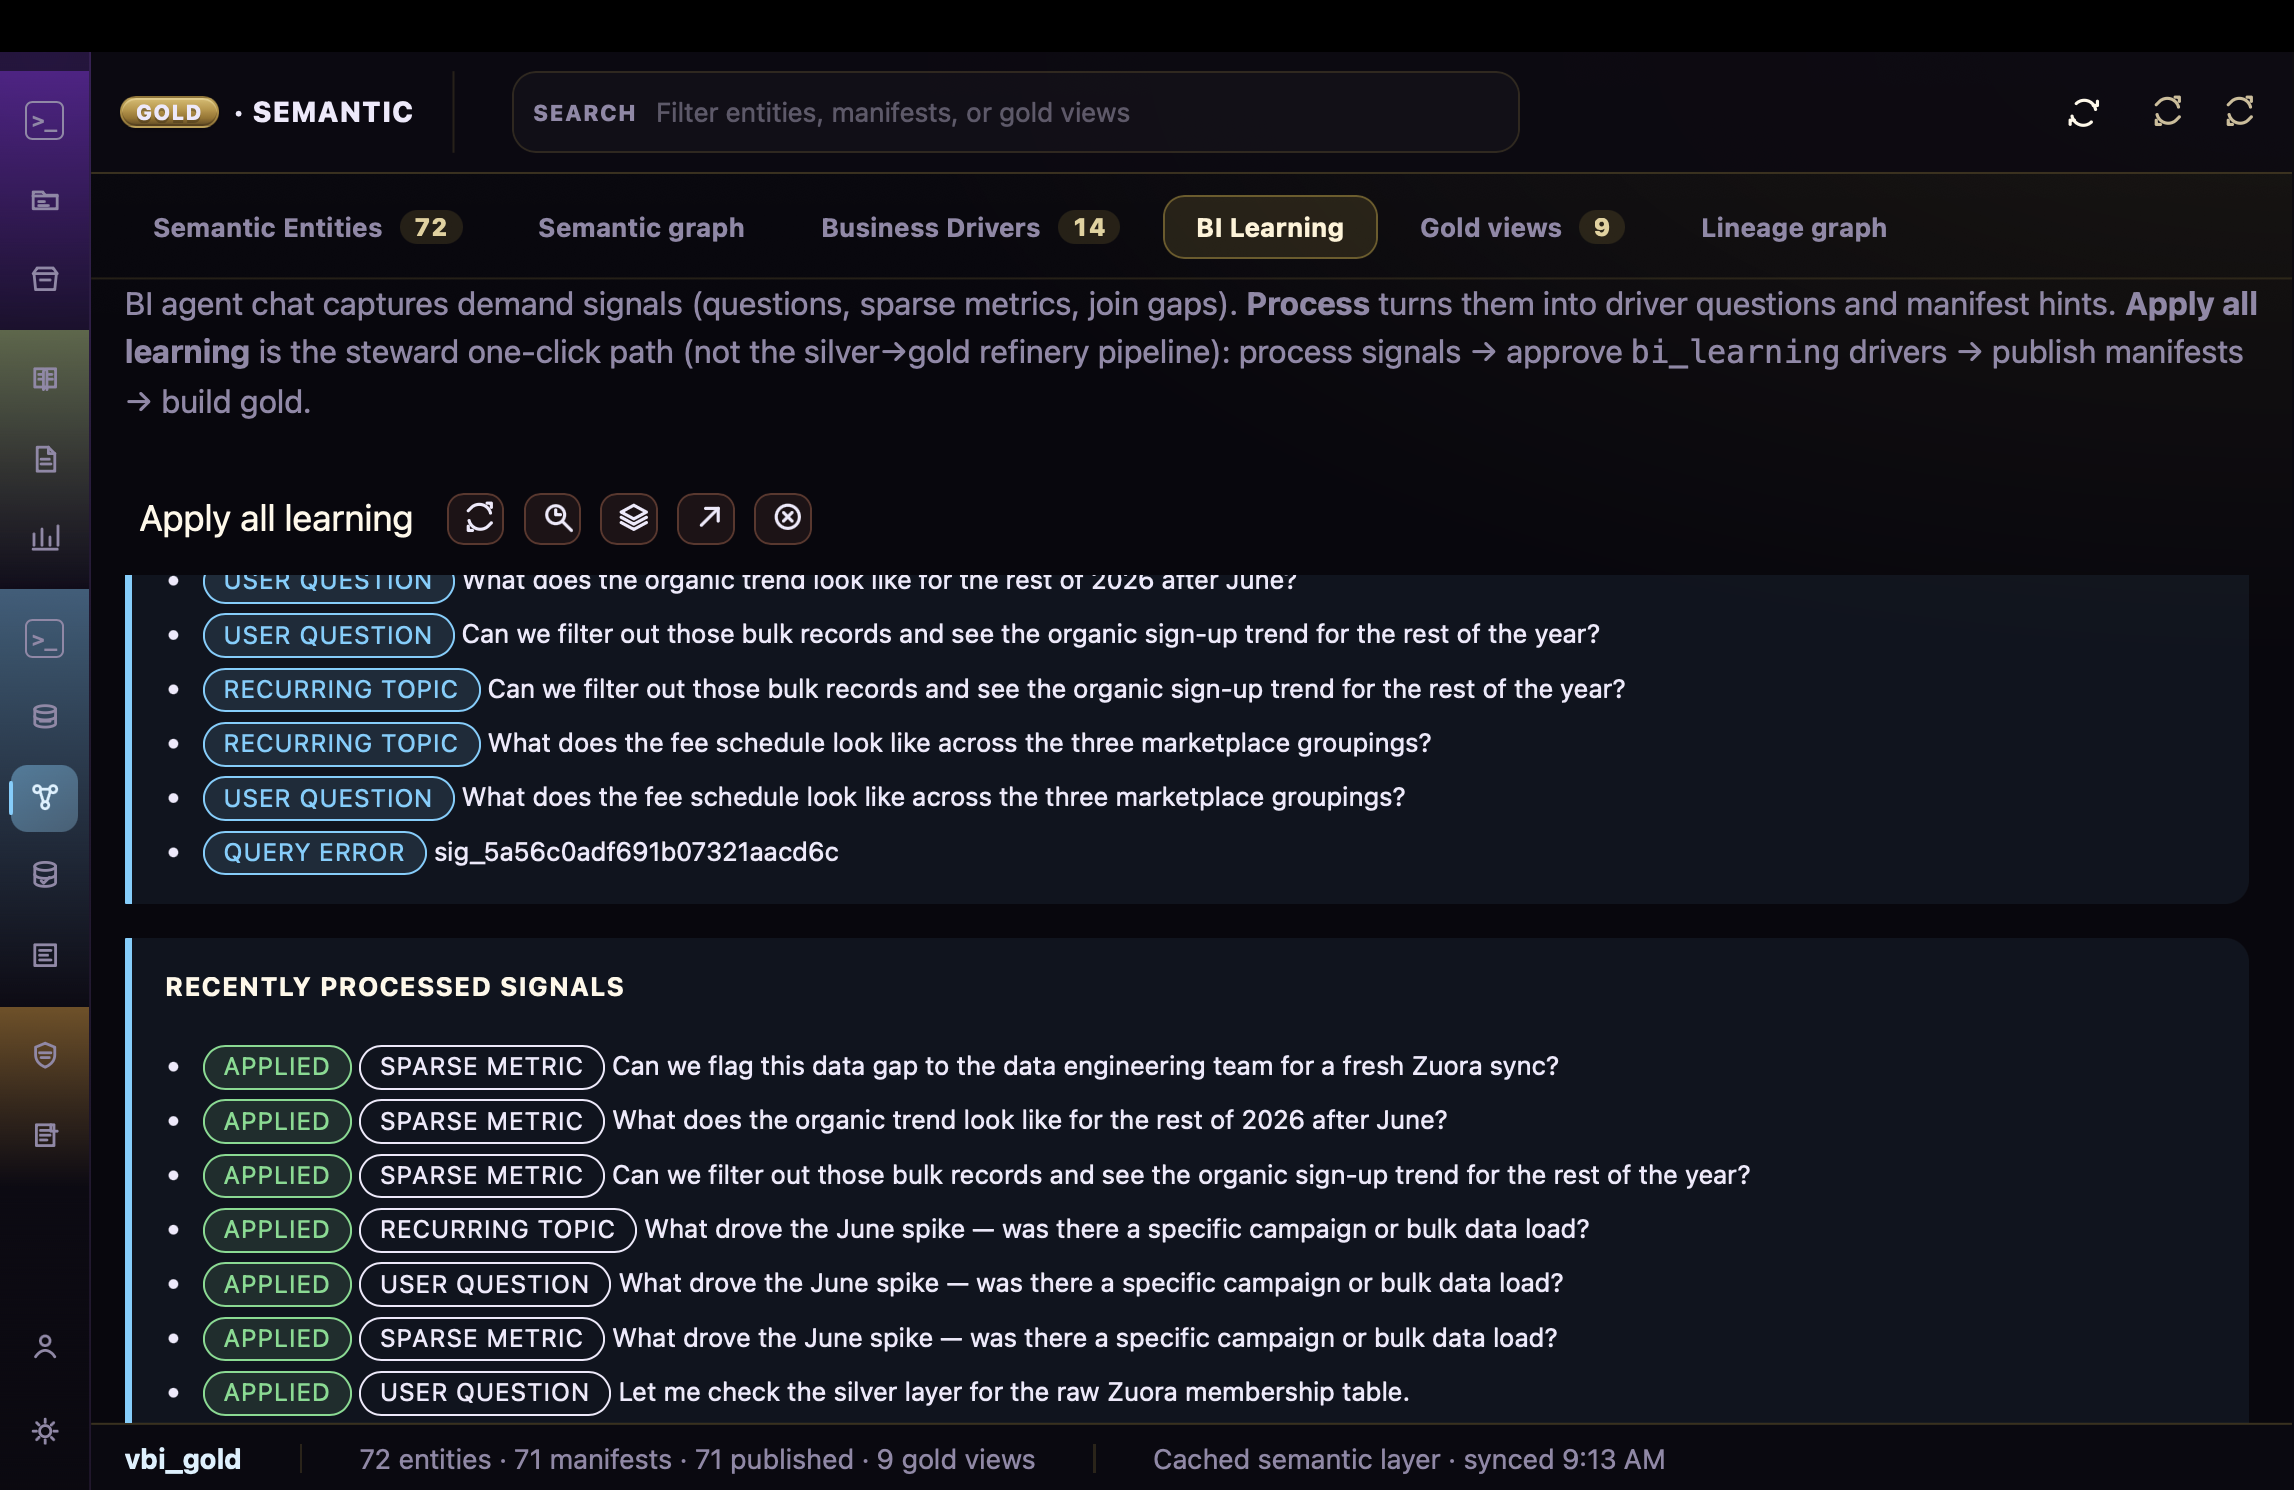 The BI Learning backlog — signals from every chat turn, processed by stewards with full-pipeline rebuilds behind certification gates. Click to enlarge.
A built-in performance monitor gives you real-time visibility into resource usage, query latency, agent throughput, and system health — all from inside the platform. No separate monitoring stack to install. No opaque cloud dashboards. Your infrastructure, your metrics, your control. Because on-premise means you own the operations, not just the data.
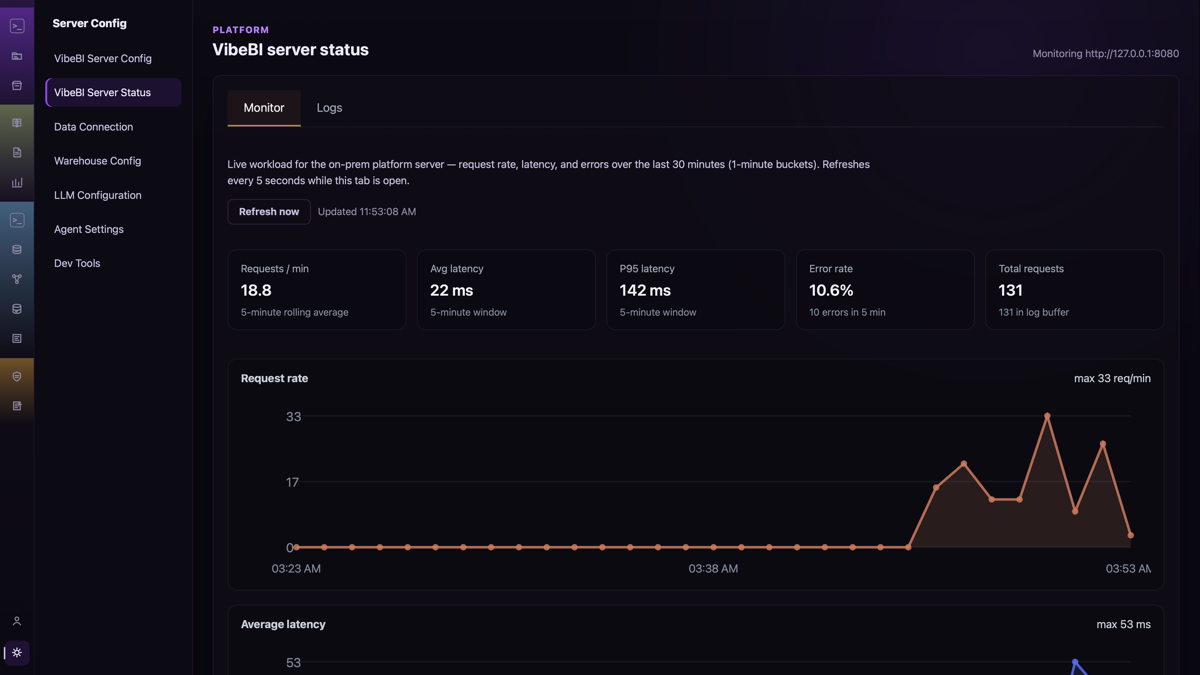 Real-time resource usage, query latency, agent throughput, and system health — all built in, no separate monitoring stack. Click to enlarge.
Download the desktop app, the server, and the SimEDW sample data — and work through your first governed warehouse build in an afternoon.